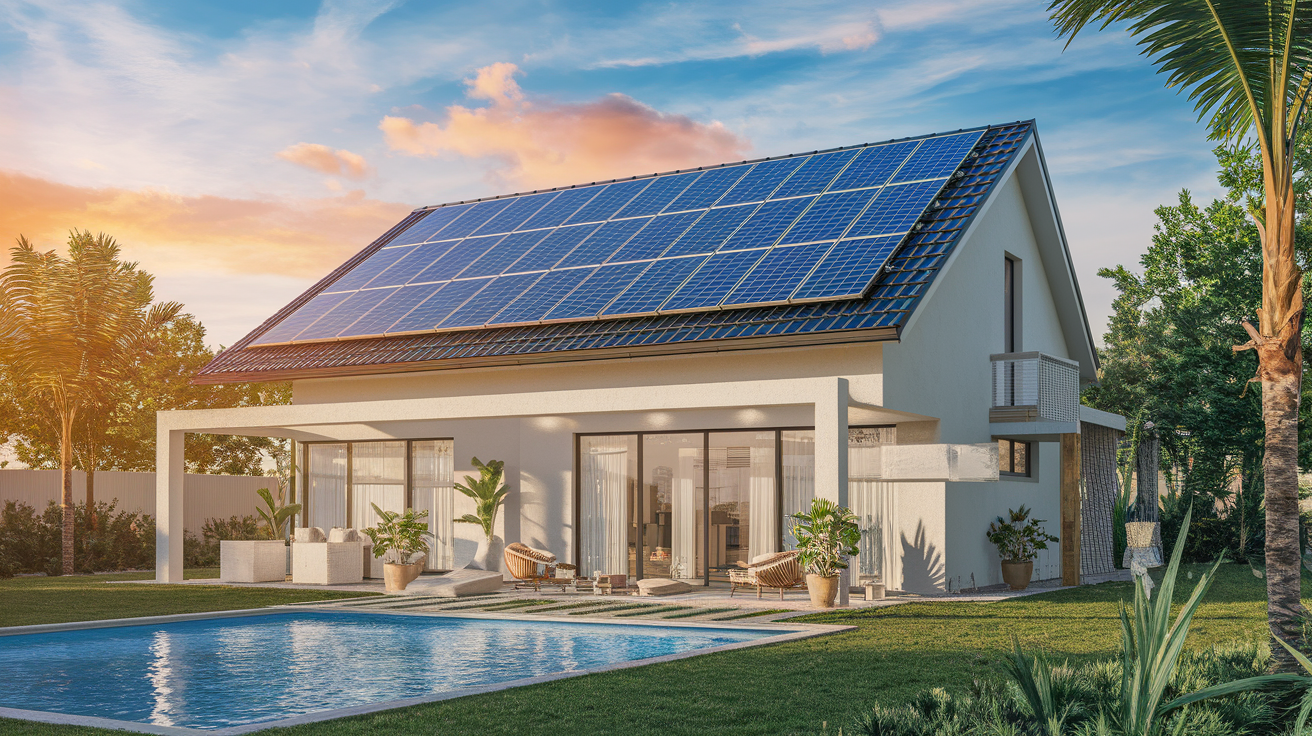
Many homeowners rely on simple checks to track output; you should use live data, inspect for shading and cleaning, and watch for a sudden output drop that signals danger. Regular monitoring boosts savings and system life-use alerts to catch issues early and confirm maximized energy.
Key Takeaways:
- Install a monitoring system (inverter portal, dedicated monitor, or smart meter) to track real-time production and consumption.
- Compare measured output to expected output using system size, local irradiance, temperature, and historical data to spot underperformance.
- Inspect panels regularly for shading, soiling, damage, and loose connections; clean panels and trim foliage when needed to restore output.
- Use metrics such as performance ratio, specific yield (kWh/kWp), and downtime to quantify system health and guide troubleshooting.
- Set automated alerts for drops in production, review inverter logs and firmware, and keep a maintenance log to resolve issues quickly.
Essential Metrics for Solar Energy Analysis
Tracking Kilowatt-Hours and Daily Power Yield
You should log daily kWh output and compare it against expected production to build a reliable baseline of your system’s daily yield.
Monitor multi-day trends for a sharp drop, which often signals shading, soiling, or inverter faults that require prompt inspection.
Understanding Performance Ratio and Efficiency Benchmarks
Track the Performance Ratio (PR) to see how effectively your array converts available irradiance into usable energy and to compare real output with modeled expectations.
Analyze module and inverter efficiency and watch for sustained PR below ~0.75 or steady declines, as these indicate underperformance that reduces system returns.
Compare PR against historical baselines and weather-corrected models so you can isolate mechanical faults, soiling, or mismatches; set alerts for deviations and prioritize fixes when you detect consistent underperformance.
Types of Solar Monitoring Technologies
- Integrated inverter monitoring – built into the inverter for system-level monitoring.
- Sensor-based hardware – independent sensors for irradiance, temperature, and current.
- Module-level solutions – microinverters or optimizers giving per-panel data.
| Integrated inverter software | Onboard monitoring with vendor dashboards, remote firmware updates and alerts for faults. |
| Independent sensor hardware | External sensors and dataloggers measuring irradiance, temperature and string currents for validation. |
| String-level monitoring | Monitors performance per string to detect mismatches and reduced output. |
| Module-level monitoring | Per-module data via microinverters or optimizers for hotspot and shading detection; supports increased yield. |
| Cloud analytics & apps | Centralized aggregation, performance trending, and automated alerts for maintenance prioritization. |
Integrated Inverter Monitoring Software
Inverters include vendor-grade dashboards that let you track production, check faults, and receive push alerts on mobile so you can compare daily yield against historical baselines.
Independent Sensor-Based Monitoring Hardware
Sensors install near arrays to record irradiance, temperature and current so you can validate actual performance versus modelled expectations and spot soiling or shading issues early.
You pair sensors with dataloggers and cloud services to get fine-grained trends and local diagnostics; fault alerts reduce downtime. Thou prioritize sensor placement to avoid false positives and protect equipment.
Factors Influencing Real-World Energy Output
Key Factors and Effects
| Factor | Effect / Mitigation |
|---|---|
| Shading | Can cause large, non-linear output loss; inspect and trim trees or adjust layout |
| Soiling | Dust and debris lower yield; schedule regular cleaning |
| Temperature | High heat reduces efficiency; improve ventilation and mounting |
| Component Degradation | Long-term decline in output; run baseline tests and track degradation rates |
| Wiring Loss | Resistive losses and faults reduce harvest; inspect connections and measure resistance |
Environmental Impacts: Shading, Soiling, and Temperature
Shading, soiling and elevated temperature each cut into your array’s yield in different ways; shading creates disproportionate losses, soiling causes steady degradation, and heat lowers module efficiency.
- Shading: check for intermittent shadows and install optimizers or relocate panels
- Soiling: monitor production drops and set a cleaning schedule
- Temperature: track ambient and module temps to spot thermal stress
System Variables: Component Degradation and Wiring Loss
Aging of modules and inverters drives component degradation-you should watch for microcracks, PID, and declining IV curves; these issues can create hotspots and increased fire risk if left unaddressed.
Knowing you must log per-string output, compare against modeled degradation rates, and test DC resistance to catch wiring loss early so you can schedule targeted repairs and maintain expected energy yield.
Step-by-Step Guide to System Configuration
Connecting Communication Gateways to Local Networks
Connect the gateway to your router via Ethernet or secure Wi‑Fi, assign a static IP or reserve a DHCP lease, and ensure the gateway firmware is updated before commissioning to avoid compatibility issues.
Secure the gateway by changing default credentials, enabling WPA2/3 for wireless links, and restricting access with a local firewall or VLAN so that unauthorized access is prevented.
Gateway Configuration Checklist
| Physical link | Ethernet/Wi‑Fi connection |
| IP | Static or DHCP reservation |
| Security | Change defaults, enable encryption |
| Ports | Open required ports only (monitoring/API) |
Establishing Performance Baselines for Comparative Data
Record initial production, irradiance, and module temperature over at least two weeks of typical weather so you can define a baseline that reflects normal system behavior.
Collect normalized metrics such as kWh/kW and heat‑corrected output, then compare against manufacturer specs and clear‑sky models to spot early deviations from expected performance.
Baseline Data Points
| Metric | How to measure |
| Energy | Daily kWh, normalized by system size |
| Irradiance | Onsite pyranometer or nearby weather station |
| Temperature | Module or ambient sensors |
Analyze rolling averages and remove outliers caused by storms or maintenance, then set percent‑deviation thresholds (for example, 10%) to flag performance that warrants investigation.
Baseline Analysis Tips
| Sample window | 2-4 weeks of representative data |
| Normalization | Adjust for irradiance and temperature |
| Thresholds | Set actionable deviation limits |
Setting Up Automated Error Alerts and Reporting
Set alert rules for inverter faults, string failures, and communication loss, and route notifications via email, SMS, or your maintenance platform so you receive timely warnings.
Define scheduled reports that include daily yield, performance ratio, and exception logs; you should include visual trends and attach raw logs for quicker troubleshooting by your team.
Alert & Reporting Settings
| Alert type | Immediate (faults) / Delayed (performance dip) |
| Channels | Email, SMS, webhook to ticketing |
| Report cadence | Daily summaries, weekly trends, monthly KPIs |
Automate escalation paths so that persistent faults trigger higher‑priority notifications and maintenance tickets, and ensure actionable logs are attached to each alert for rapid diagnosis.
Escalation Matrix
| Trigger | Action |
| Single inverter fault | Notify operator |
| Repeated faults | Escalate to field service |
| Data loss >1 hour | Open support ticket |
Pros and Cons of Monitoring Methodologies
You should weigh trade-offs between cost, detection speed, and data control when choosing a method; module-level monitoring exposes panel faults quickly while inverter-only systems are cheaper but can miss localized issues.
Pros and Cons
| High-level system visibility | Misses module-level faults and shading |
| Module-level granularity detects single-panel failures | Higher hardware and data costs |
| Inverter monitoring is low-cost and easy | Limited fault localization |
| String-level monitoring balances cost and detail | Requires additional installation complexity |
| Third-party analytics offer benchmarking | Data privacy and vendor lock-in risks |
| On-site meters provide accurate energy accounting | Installation and meter calibration expenses |
| Weather/irradiance sensors improve normalization | Sensor maintenance and placement errors |
| DIY/open-source solutions reduce fees | Lack of support and reliability concerns |
Comparing Manufacturer Platforms vs. Third-Party Apps
Manufacturer platforms often provide integrated diagnostics and warranty-linked alerts; you get vendor-optimized data and support but face vendor lock-in and limited export options.
Third-party apps offer cross-vendor benchmarking and advanced analytics; you gain flexibility and broader comparisons but should watch for data sharing requirements and extra integration steps.
Platform Comparison
| Integration with hardware and warranties | Cross-vendor comparison and benchmarking |
| Vendor-controlled data export limits | You can often export or control access |
| Simpler setup for matching equipment | May require adapters or additional sensors |
| Support tied to manufacturer | Independent support but variable quality |
| Often included or low-cost | May charge subscriptions for advanced features |
Evaluating Subscription Models and Data Granularity
Subscriptions can gate features and sampling rates; you should check whether free tiers limit export, real-time alerts, or high-frequency data needed for fault detection.
Consider how sampling frequency affects detection speed and whether raw exports are available for your analysis; you may pay more for higher granularity and longer data retention.
Expert Tips for Optimizing Long-Term Performance
Strategic Cleaning and Maintenance Schedules
You should set a seasonal and weather-driven plan to protect solar panel performance, pairing monthly visual checks with quarterly washes where you see soiling. Regular cleaning can raise output by 5-15%, while ignored grime creates hotspots that increase fire risk.
- Inspect panels after storms and heavy pollen
- Clean with a soft brush and deionized water
- Schedule a professional maintenance audit annually
Utilizing Data Trends to Predict Equipment Failure
Use your monitoring dashboard to establish a baseline for performance and flag sustained declines or rising noise floors that often precede equipment failure. Set thresholds so you get alerts before losses compound.
Identify repeating dips by correlating output with temperature, irradiance, and soiling patterns; export trend reports to compare arrays and pin down failing modules or wiring. Keep historical logs for technician handoff.
Any anomaly you ignore can escalate into inverter faults or hotspots, so enable automated alerts, perform targeted inspections, and keep clear records for faster remediation.
To wrap up
From above you should monitor daily using your inverter’s dashboard or a monitoring app, compare production with expected output and local weather, and flag sustained drops for inspection.
You should perform periodic visual checks for shading, dirt, and wiring issues, keep simple production logs, and contact your installer when output falls or alarms appear.
FAQ
Q: How can I monitor daily and real-time performance of my solar panels?
A: Most modern inverters include built-in monitoring accessible via a mobile app or web portal. These portals show instant power, energy produced today, historical daily and monthly yields, and inverter alarms. Set email or push notifications for power drops, inverter faults, or communication losses so you see problems right away. Third-party monitoring systems and home energy management platforms add features such as string- or module-level data, site-wide dashboards, and integration with weather and utility data.
Q: What performance metrics should I track to detect underperformance?
A: Key metrics include daily energy (kWh), specific yield (kWh/kWp), and performance ratio (PR). Performance Ratio compares actual production to theoretical production under given irradiance and temperature; typical PR values range roughly from 75% to 90% depending on system design and location. Track normalized energy per irradiance (kWh per kW of peak per peak sun-hour) to factor out weather, plus instantaneous power and inverter efficiency. Flag persistent PR drops greater than about 10% or daily energy decreases over 15% compared with the same weather conditions for further investigation.
Q: What step-by-step troubleshooting should I follow for a sudden drop in output?
A: Begin by checking the inverter display and monitoring portal for alarms or error codes. Compare production to local irradiance or a nearby solar site to rule out cloudy weather. Inspect panels for visible shading, debris, snow, bird droppings, or physical damage. Verify DC and AC disconnects, breaker positions, and combiner box fuses; confirm wiring connections are tight and free of corrosion. If module-level devices are installed, check optimizer or microinverter status. Perform a system reboot or inverter firmware check only when you understand the risks; contact your installer or a qualified electrician if electrical work or major diagnostics are required.
Q: Do I need module-level monitoring, and what are the benefits?
A: Module-level monitoring (via power optimizers or microinverters) provides per-module generation data and rapid identification of underperforming modules or shading impacts. This level of detail simplifies warranty claims and speeds diagnosis of specific failures, mismatches, or soiling problems. The trade-off includes higher upfront cost and more data to manage; module-level systems are most cost-effective for complex roof layouts, partial shading, or commercial arrays where pinpointing faults delivers measurable gains.
Q: How often should I review system data and what maintenance schedule should I follow?
A: Configure automatic daily alerts and perform a quick weekly review of production graphs to catch abrupt changes. Run a monthly performance comparison against historical data adjusted for irradiance to detect gradual degradation. Schedule visual inspections every three months for soiling, roof leaks, and mounting integrity; plan professional electrical and IV-curve testing every 1-3 years depending on system size and warranty terms. Clean panels as needed based on local soiling (commonly 0-4 times per year), trim nearby vegetation that causes shading, and keep inverter firmware and monitoring software up to date.